
Nasdaq futures after Nvidia: The rebound has more volume. Can buyers make it count?
Market analysis and trading education | November 18, 2026
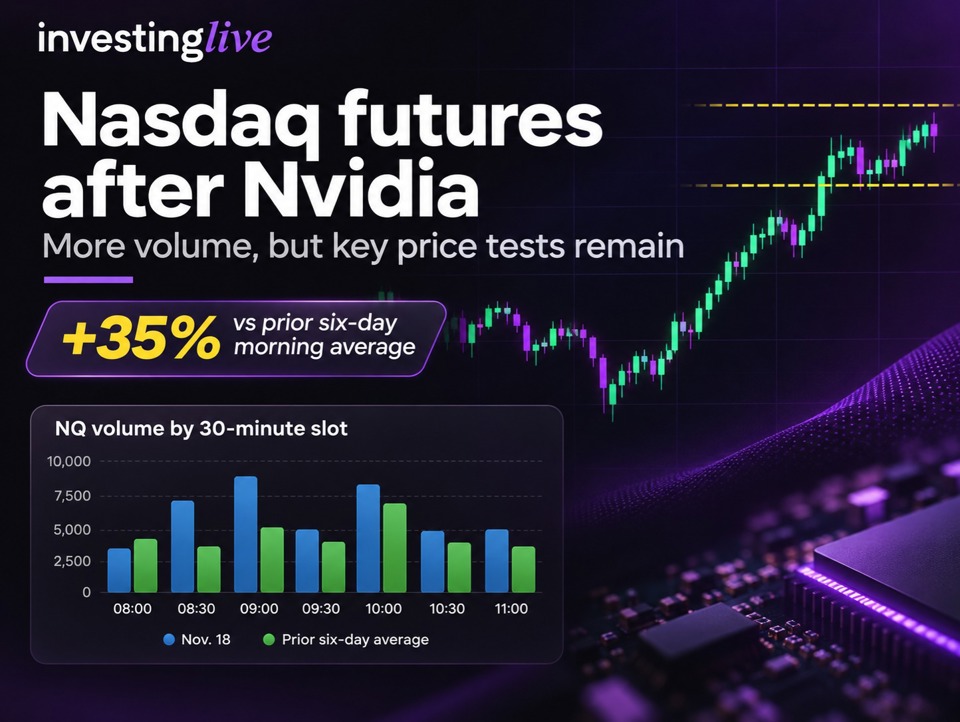
Nasdaq-100 futures traded 35% more contracts than their recent European-morning average following Nvidia's earnings. But higher trading activity has not produced a convincing breakout, leaving traders with important price levels to watch.
Nasdaq-100 futures are recovering after Nvidia's latest earnings report, but is the rally running out of volume? The evidence suggests otherwise. Trading activity is above recent norms when we compare the same times of day. The bigger question is whether that increased activity can help buyers hold higher prices.
A trader on social media in the last hour made an interesting prediction: "I don't think Nasdaq is going to hold. We're going to finish red because the recent rallies lack volume." Perhaps the market will finish lower, perhaps it won't. But there is an important question worth asking before accepting that reasoning: Lack of volume compared with what?
Many traders look at volume bars and compare them with a moving average. That can be useful, but it can also be misleading. Trading activity naturally changes throughout the day, and a moving average may combine relatively quiet periods with unusually active ones. In this particular case, the average was influenced by elevated overnight trading following Nvidia's earnings. Comparing today's European morning with those unusually active hours is not necessarily comparing apples with apples.
A more meaningful approach is to compare the same time slots across different trading days. For example, the 11:00-11:30 Berlin time bar on November 18 recorded 5,027 Nasdaq futures contracts, approximately 20% below its 20-bar moving average. At first glance, that might suggest weak volume. But compared with the same half-hour across the previous six trading days, activity was actually 37% above average! Across the seven completed morning bars, total volume was approximately 35% higher than the comparable six-day average.
That gives us a very different interpretation of the same market. It doesn't guarantee the rally will continue, and the trader's bearish prediction could still prove correct. It simply means that the argument about weak volume is not supported by this more relevant comparison. The broader lesson is to understand what your indicator is measuring, choose an appropriate benchmark, and then examine whether price can actually hold important levels. Higher volume tells us there is more activity, not who will ultimately win the battle between buyers and sellers.
The Nasdaq recovery is more active than it first appears
Between 08:00 and 11:30 Berlin time on November 18, CME E-mini Nasdaq-100 futures (NQ) recorded 42,335 contracts across seven completed 30-minute periods.
That compares with 34,181 contracts during the same period on Tuesday and an average of approximately 31,375 contracts across the previous six trading days.
That represents 34.9% more trading volume than the recent six-day average, and the highest comparable morning total in this seven-session sample.
So why might a trader looking at a conventional volume indicator get the impression that trading activity is weak?
Consider the final completed 30-minute period, from 11:00 to 11:30 Berlin time.
It recorded 5,027 contracts, approximately 20% below its rolling 20-bar volume average of 6,310. However, compared with the same half-hour across the preceding six trading days, volume was actually 37% higher.
Both observations are correct, but they answer different questions.
The rolling average includes earlier, unusually active overnight trading following Nvidia's earnings. Comparing identical clock-time periods gives a more useful picture of whether this particular part of the session is unusually quiet or active.
This is an important trading lesson: volume should be evaluated in context, not in isolation.
Nvidia delivered strong earnings, but the price reaction tells a more complicated story
Nvidia reported third-quarter fiscal 2027 revenue of $115.8 billion on November 17, up 103% from a year earlier. The company also projected approximately $130 billion in revenue for the following quarter, plus or minus 3%.
Nasdaq futures initially reached 27,609.75 after the announcement, but failed to sustain trading above Tuesday's high of 27,498.Prices subsequently retreated to 27,093 before recovering during the European morning.
By the 11:30 Berlin analysis cutoff, NQ stood at 27,365, above Tuesday's final recorded close of 27,126 but slightly below Wednesday's session opening level of 27,382.
This tells us something important. Higher trading volume has accompanied a recovery, but it has not yet established clear bullish control.
The market is still trying to decide how much of the initial post-earnings repricing it is prepared to maintain.
Nasdaq futures key levels: What traders should watch next
The following levels refer to E-mini Nasdaq-100 futures as of 11:30 Berlin time on November 18. They are not live quotes.
27,410-27,425: The immediate resistance test
This area includes a developing upper value-area boundary around 27,416 and two recent morning highs. Holding above it on completed candles, rather than briefly crossing it, would make the recovery more convincing.
27,485-27,500, followed by 27,610: The next upside obstacles
The first area includes Tuesday's high near 27,498. Above that, Wednesday's post-earnings high at 27,609.75 becomes an important test of whether buyers can regain the initial optimism.
27,260-27,320: A support area worth protecting
This region contains several estimated areas of previous trading interest, as well as the session's volume-weighted average price near 27,317 at the analysis cutoff.
Continued trading above this region would support the recovery argument. Falling back below it would suggest that buyers are giving up some of their morning progress.
27,093: The overnight low
If the recovery weakens materially, this is a significant lower reference. A sustained break would put Tuesday's low near 26,658.50 back into focus.
Volume-derived value boundaries are estimates and can change as the session develops.
A lesson for traders: Strong volume is not the same as strong price acceptance
Tuesday provided another useful example. An earlier Nasdaq futures rally attracted considerable trading activity but did not prevent a subsequent decline.
This is why volume alone cannot establish whether a rebound will succeed.
Traders should combine the amount of trading activity with what price actually achieves. Does it break resistance and stay above it? Does an earlier resistance area become support? Or does price repeatedly retreat despite higher trading activity?
For now, the constructive scenario would involve holding the nearby support region, sustaining trading above 27,425 and eventually challenging higher resistance.
Repeated rejection followed by a loss of 27,260-27,320 would weaken that interpretation.
There is also a third possibility: Nasdaq futures continue trading between these areas without establishing a clear direction. In that situation, waiting for better evidence may be more sensible than forcing a trade.
The first regular U.S. stock-market session following Nvidia's earnings, scheduled to open at 15:30 Berlin time, remained ahead at this analysis cutoff.
The takeaway: Nasdaq futures' European-morning rebound has attracted above-average volume. Whether that activity translates into lasting buying strength remains an open question. Price behavior around the next important levels will help traders judge the answer.
This article was written by Itai Levitan at investinglive.com.Pôvodne publikované na investinglive.com