As Bitcoin consolidates, the technical resistance gets closer and closer to the price. What next?

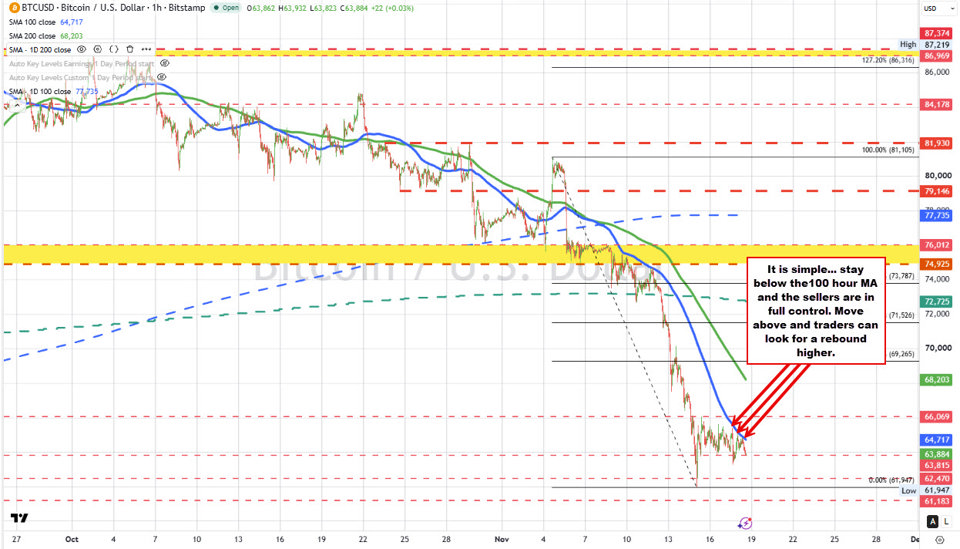
Bitcoin continues to consolidate in a modest range, allowing the falling 100 hour moving average to catch up to the price. When Bitcoin reached its Sunday low at $61,947, the 100 hour moving average was up at $70,244 (close to $8300 above the price). Today, the moving average is down to $64,717, while Bitcoin is trading at $63,886. At today’s session high, the price nearly reached (i.e. was identical) the moving average before rotating back to the downside. That is as a result of the consolidation or breather, that the market is doing at the lower levels.
In the video above, I take a look at the technicals, explain why traders are leaning against the 100 hour moving average, and outline the targets on a break in either direction.
The 100 hour moving average is the barometer
The last three tests of the 100 hour moving average have found willing sellers. That tells me traders are watching the level and using it to define their risk. As long as the price stays below it, the sellers remain in control.
If buyers can get and stay above $64,717, they would score a technical victory and have a level to lean against on a pullback. That would shift the short-term bias modestly to the upside. The next test would be whether buyers can build on the break and take out Sunday’s corrective high.
What are the targets on a break?
On the topside, a move above the 100 hour moving average at $64,717 would have traders looking toward Sunday’s corrective high at $66,069. Get above that level and the next targets come in at the falling 200 hour moving average at $68,203, followed by the broken 38.2% retracement of the November trading range at $69,265.
On the downside, the first support is near today’s lows around $63,800. A break below would put Sunday’s low at $61,947 back in focus. Below that, traders would look toward the natural support at $60,000, followed by the June low and the low for the year at $57,735.
The trading lesson
Consolidation can bring a falling moving average back into play even when the price makes little headway. On Sunday, Bitcoin was $8,297 below its 100 hour moving average. Today, it came close enough for sellers to lean against it again. If buyers finally get above it, watch what happens on the next dip. If the moving average starts to hold as support, buyers have a level to define their risk and a better shot at testing $66,069.
This article was written by Greg Michalowski at investinglive.com.Pôvodne publikované na investinglive.com