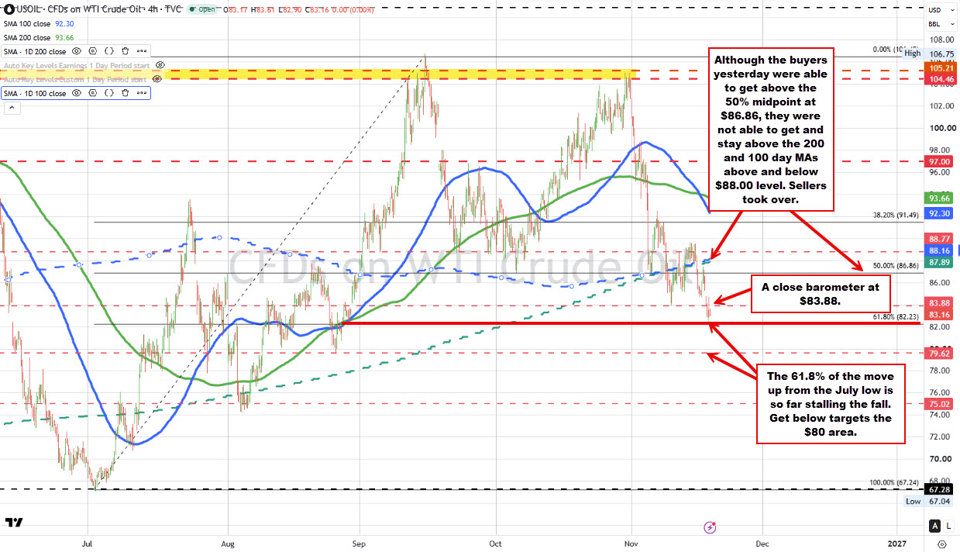
Crude oil is trading lower after yesterday's run to the upside found willing sellers. What next?

The rally stalled shy of the daily moving averages
Crude oil moved higher yesterday, reaching an intraday high of $87.38. That took the price back above the 50% midpoint of the move up from the July low at $86.86. The next two targets were the 200-day moving average at $87.89 and the 100-day moving average at $88.16. Both stayed out of reach, and the price slipped back below the midpoint into the close.
Sellers break the November low and eye $82.23
The downside momentum continued today, taking the price below the November 10 low at $83.88 and down to $82.38. That put crude within $0.15 of the 61.8% retracement at $82.23.
A move below $82.23 would increase the bearish bias and have traders looking toward the natural support at $80.00, followed by the August 26 low at $79.62.
The close barometer is $83.88
On the topside, a move back above $83.88 would give buyers a glimmer of hope. They would need to stay above that level to build confidence in a corrective move back toward the $86.86 midpoint. As long as the price stays below $83.88, the sellers hold the stronger hand.
In the video above, I walk through the failed move above the midpoint, why $83.88 is the closest barometer for bias and risk, and what a break below $82.23 would open up on the downside.
Meanwhile...EIA inventory data lean bearish for crude oil
US crude inventories rose by 3.380 million barrels, well above the 58,000-barrel build expected. Gasoline posted the biggest build and the biggest surprise, rising by 5.192 million barrels versus 1.645 million expected. Distillate stocks also rose more than forecast, up 1.571 million barrels versus 1.252 million expected.
The takeaway is bearish. Inventories built more than expected across crude, gasoline and distillates. The outsized gasoline build adds to the bearish bias from the crude headline and gives sellers another reason to lean against rallies.
Trading lesson. A break needs follow-through
The move above $86.86 gave buyers a technical victory. The next test was whether they could hold the midpoint on a pullback and build enough momentum to challenge the daily moving averages. Once the price fell back below $86.86, buyers lost the level they could lean against. The same test now applies at $83.88. If buyers reclaim it, watch what happens on the first pullback. A hold gives them a level to define their risk against, with $86.86 as the next upside target.
This article was written by Greg Michalowski at investinglive.com.Pôvodne publikované na investinglive.com